
A new national survey of 1,002 Americans, along with Google Trends data from the 2024 season, helps explain what drives these choices and why some households get a little spirited in the process. It’s a fun snapshot of how people across the country bring the holiday season to life.
Key Takeaways
- 32% of Americans decorate with only colored lights, while 23% prefer just white lights, and 30% use a mix of both.
- 50% of Americans say social media content influences their holiday lighting choices, rising to 61% among those with children under 18.
- Most Americans (71%) use artificial trees, with Gen Z (75%) most likely to prefer them, followed by Gen X (73%), millennials (70%), and baby boomers (63%).
- 3 in 10 Americans have disagreed with someone about what counts as tasteful tree decor, and this jumps to 36% among those living with children under 18.
- Nearly 1 in 5 (18%) say that decorating has led to a disagreement or tension in their home, especially among those living with children under 18 (25%).
Holiday Lighting Preferences and Dealbreakers
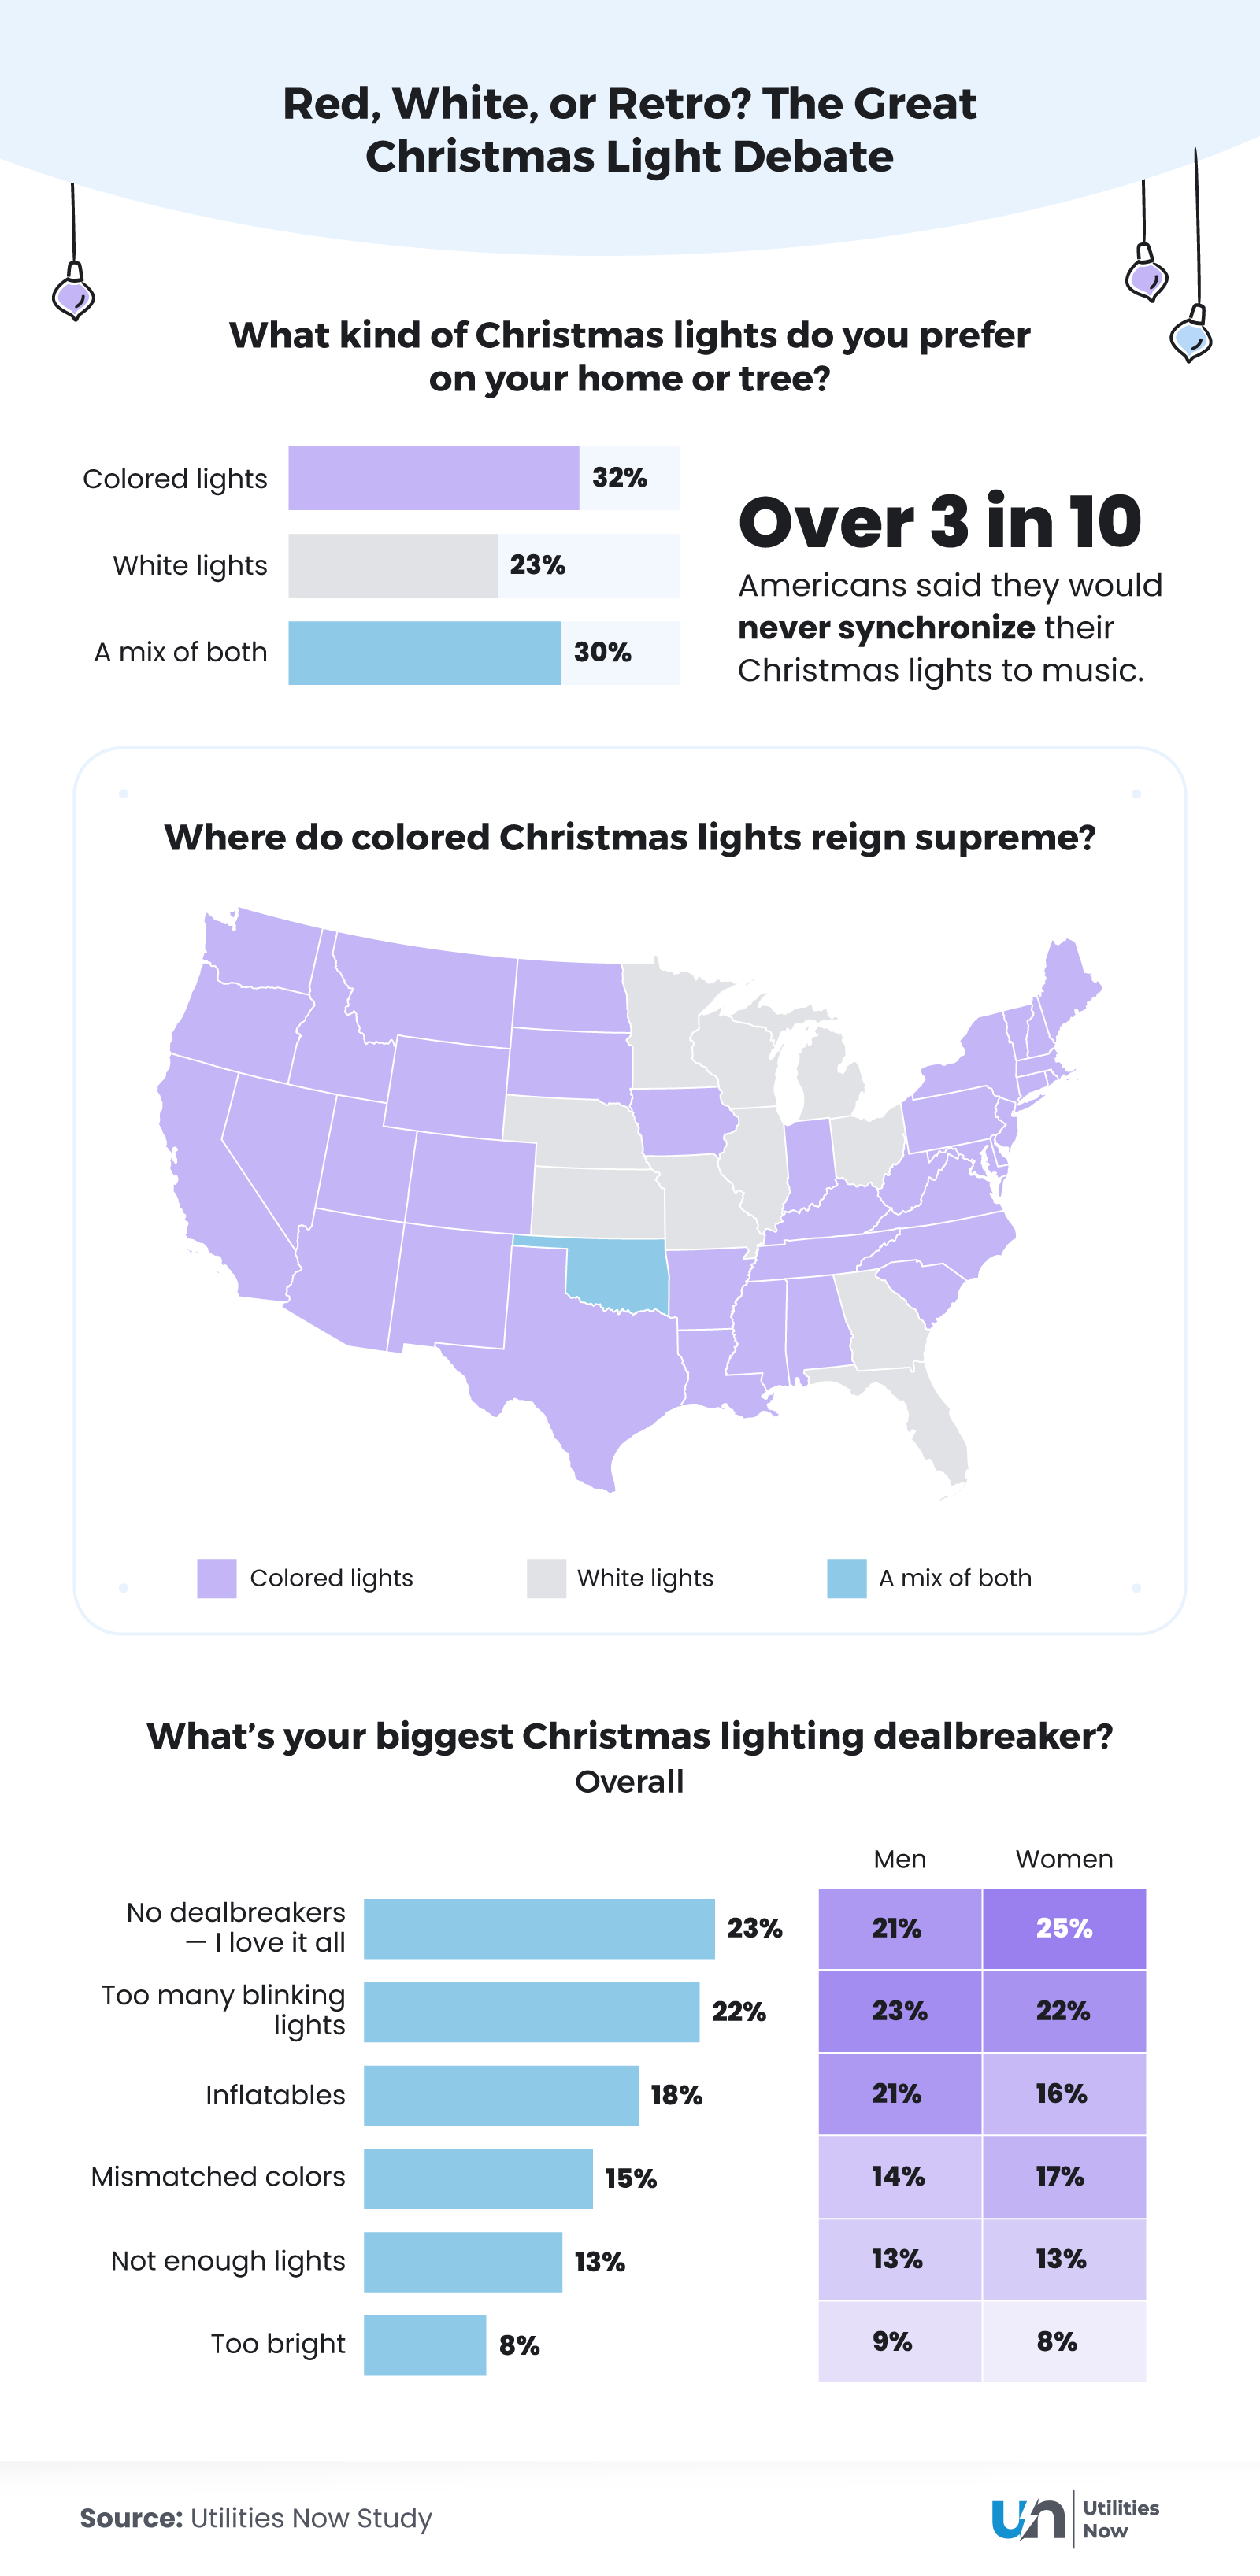
- For the holidays, 32% of Americans prefer to decorate with colored lights, 23% prefer white lights, and 30% prefer a mix of both. Over 1 in 10 (12%) have no preference, and 3% don’t put lights up for the holidays.
Social Media and Search Trends
- 50% of Americans say social media content on platforms like TikTok or Pinterest inspires their holiday light choices. Social media influence by household type:
- Children under 18: 61%
- Partner or spouse: 52%
- Adult family members: 48%
- Pets only: 40%
- Live alone: 40%
- Friends: 33%
- Roommates: 30%
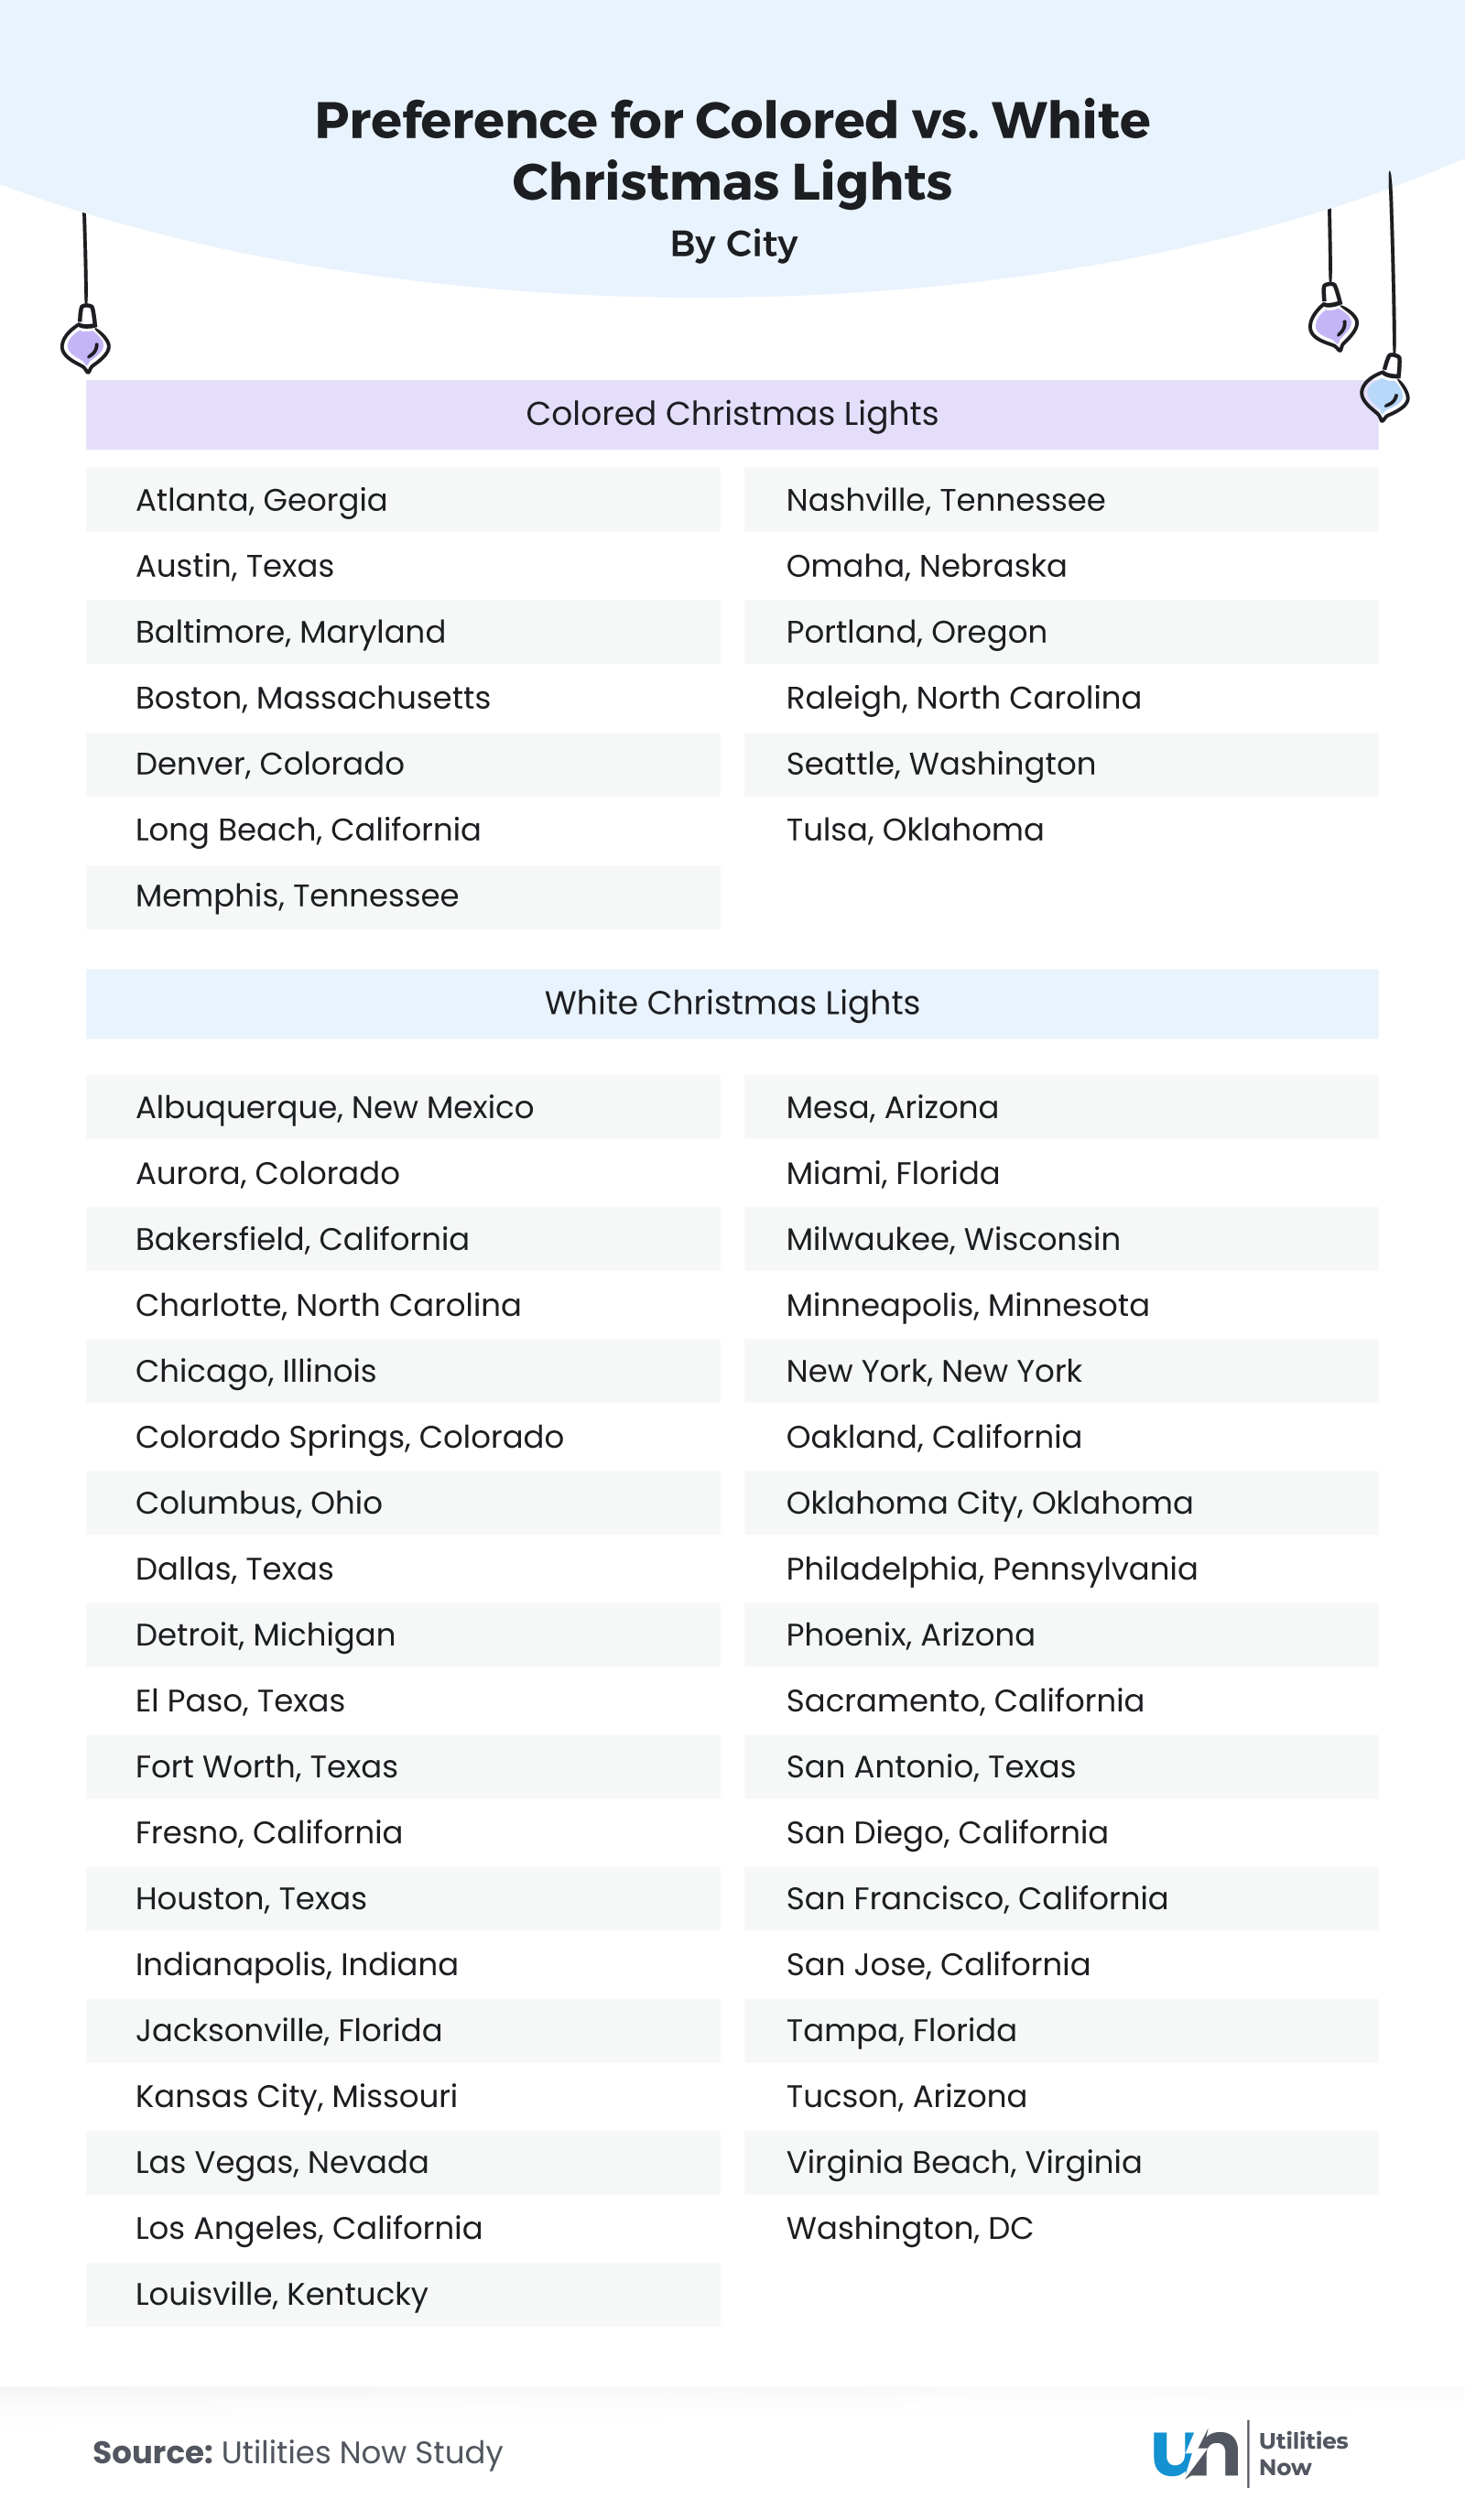
- According to Google Trends data from 2024, 90% of states favored terms such as “colorful Christmas lights” or “multicolor Christmas lights.”
- White Christmas lights were the top search in 10 states, primarily located in the Midwest and South, including Florida, Georgia, Illinois, Kansas, Michigan, Minnesota, Missouri, Nebraska, Ohio, and Wisconsin.
Christmas Lighting Dealbreakers
- 22% of Americans say too many blinking lights is their top dealbreaker, including 28% of baby boomers, 23% of Gen Z, 22% of Gen X, and 21% of millennials.
- 21% of men vs. 16% of women say inflatables are their top dealbreaker. Baby boomers (26%) are the most likely to agree, followed by Gen X (25%), millennials (17%), and Gen Z (6%).
- Gen Z (19%) and millennials (18%) are more likely than Gen X (12%) and baby boomers (3%) to say mismatched colors are their biggest dealbreaker when it comes to Christmas lighting.
- Gen Z (13%) is the most likely to say lights that are too bright are their top dealbreaker, compared to millennials (9%), Gen X (6%), and baby boomers (2%).
Christmas Tree Timing, Trends, and Traditions
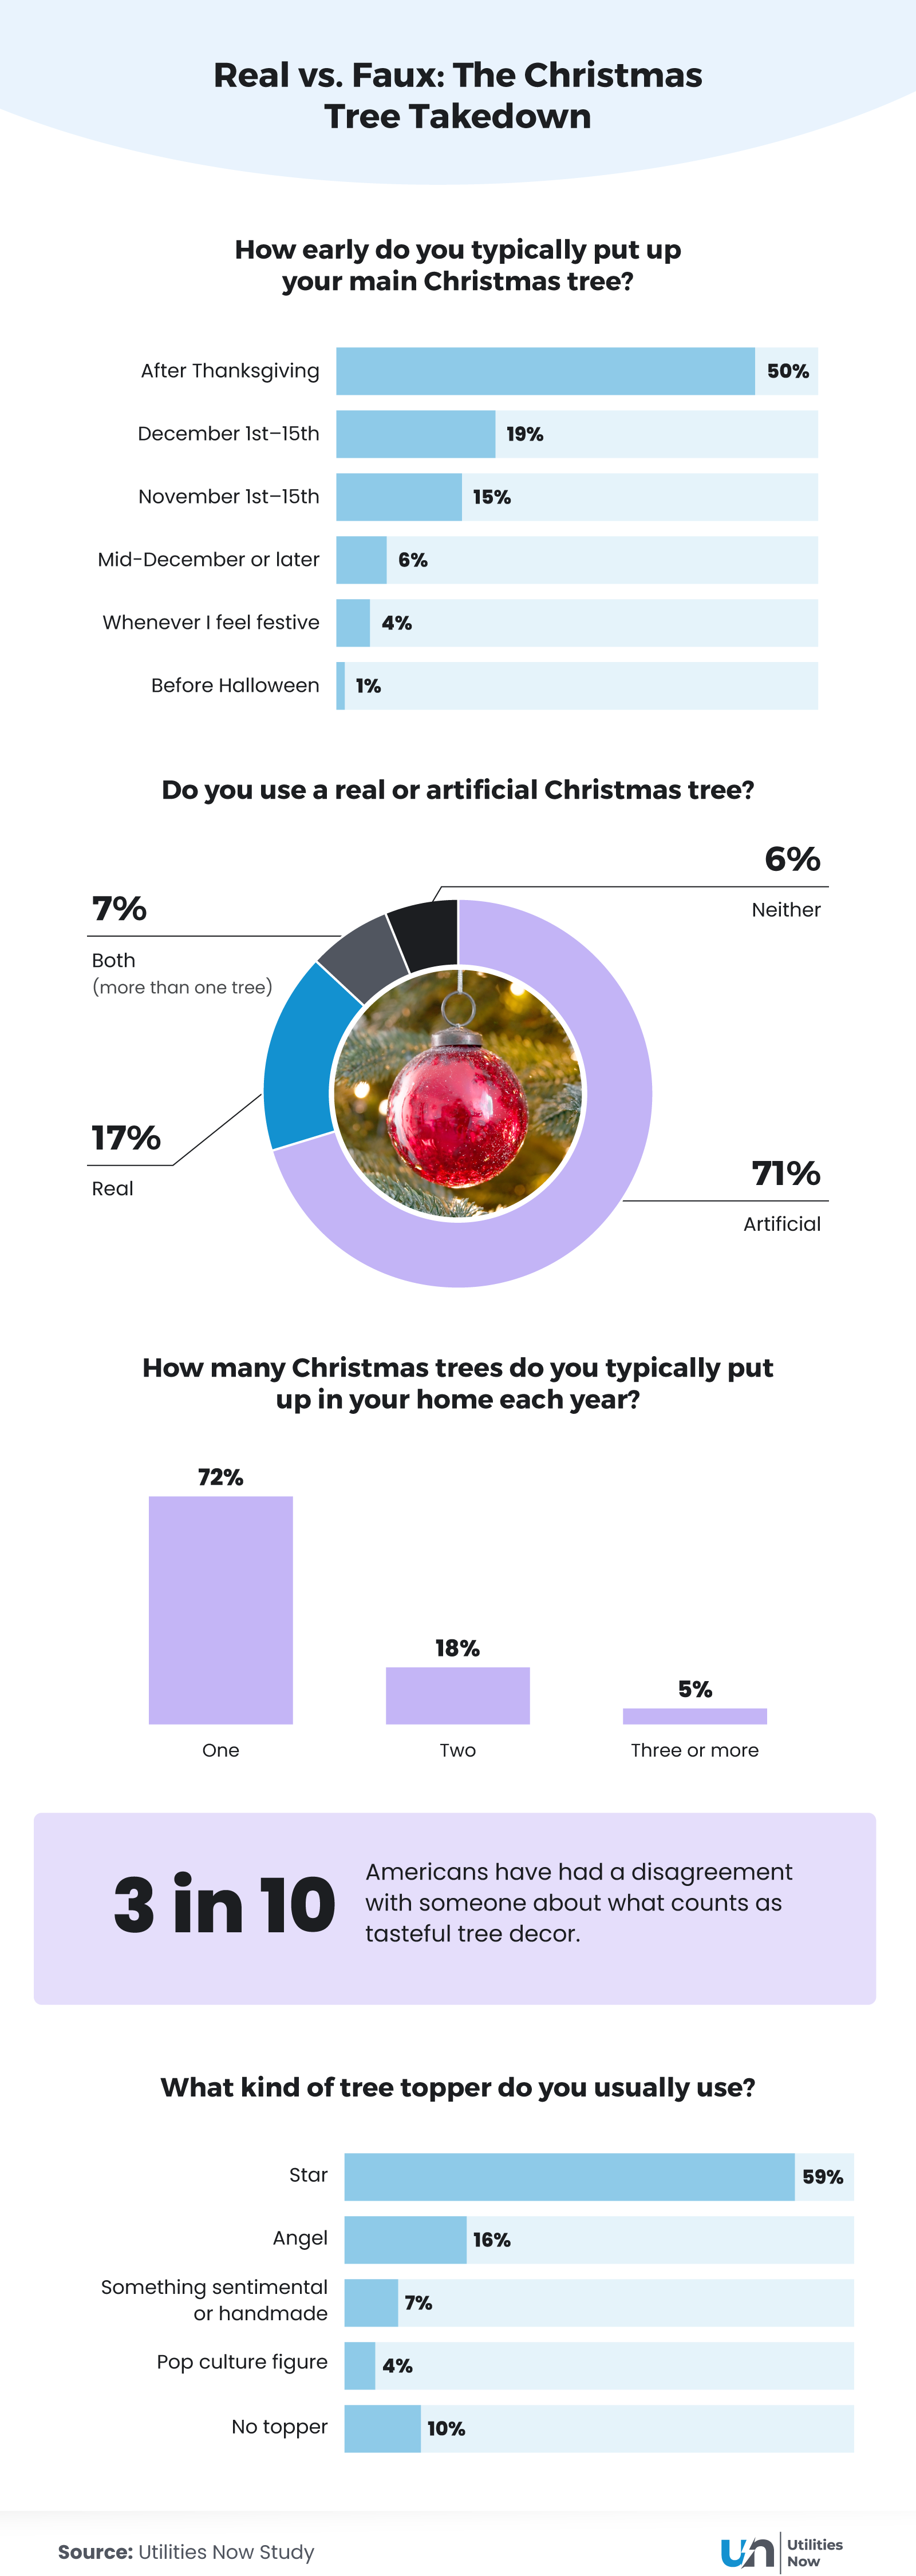
- 50% of Americans put their Christmas tree up after Thanksgiving. Those in rural areas (56%) are most likely to put their trees up before Thanksgiving, compared to suburban (54%) and urban (40%) dwellers.
Christmas Tree Preferences
- Most Americans (71%) use artificial trees. Those in cities (20%) are more likely to prefer real trees, compared to those in rural (17%) and suburban (15%) areas.
- Gen Z (75%) are most likely to prefer artificial trees, followed by Gen X (73%), millennials (70%), and baby boomers (63%).
- Baby boomers (19%) are most likely to prefer real trees, compared to millennials (18%), Gen X (16%), and Gen Z (13%).
- According to 2024 Google Trends data, “artificial Christmas tree” had the highest search volume in all 50 states and nearly every major city.
- A strong interest in real Christmas trees was still evident in parts of the Pacific Northwest, Midwest, and a few Northeastern states, but overall, the preference was overwhelmingly for artificial trees.
Tasteful Tree Decor Debates
- 3 in 10 Americans have disagreed with someone about what counts as tasteful tree decor. Disagreements by household type:
- Children under 18: 36%
- Friends: 33%
- Roommates: 33%
- A partner or spouse: 31%
- I live alone: 28%
- Adult family members: 28%
- Pets only: 18%
- The majority of Americans (59%) top their Christmas tree with a star, while 16% opt for an angel, 10% leave it bare, 7% use something sentimental or handmade, and 4% feature a pop culture icon.
- Millennials are the most likely to say they use something sentimental (8%) or pop culture-related (5%) as a tree topper, compared to other generations.
- The same is true for those living in urban areas (7% and 6%), compared to those in suburban or rural ones.
- Baby boomers (30%) are the most likely to favor angels as tree toppers compared to all other generations.
Who Runs Christmas? Inside America’s Holiday Household Politics

- 44% of Americans say they collaborate on most decorating decisions. Baby boomers are the most likely to say one person decides everything.
- 43% of Americans say one person does the actual decorating.
- Nearly 1 in 5 (18%) say that decorating has led to a disagreement or tension in their household. Here’s how this varies by household type:
- Children under 18: 25%
- A partner or spouse: 22%
- Roommates: 21%
- Friends: 17%
- Adult family members: 13%
- Most Americans (86%) haven’t tried to out-decorate a friend, relative, or neighbor, but 11% have.
- Those living with children under 18 are the most likely to say they have tried to outdecorate someone else (17%).
- Those in urban settings (18%) are most likely to have done this, compared to those in suburban (8%) and rural (9%) areas.
- Americans most often leave their decorations up until the first week of January, with 53% reporting this habit.
Methodology
Utilities Now collected insights from a survey of 1,002 Americans across multiple demographics. Respondents included millennials (50%), Gen X (24%), Gen Z (17%), and baby boomers (9%). The sample reflected a near-even gender split and a mix of urban (27%), suburban (55%), and rural (18%) environments. Relationship and household compositions ranged from single adults to families with children under 18 years old.
Google Trends data from the 2024 holiday season was also reviewed to compare state-level and city-level search interest in holiday lighting and Christmas tree preferences. For lighting, the search terms reviewed included “white Christmas lights,” “colored Christmas lights,” “multicolor Christmas lights,” “warm white Christmas lights,” and “cool white Christmas lights.” For Christmas tree preferences, searches for “real Christmas tree,” “live Christmas tree,” “artificial Christmas tree,” and “fake Christmas tree” were evaluated.
About Utilities Now
Utilities Now helps consumers make confident decisions about electricity plans, providers, and home energy choices. By simplifying complex information and providing clear comparisons, we enable households to find options that align with their budget and lifestyle.
Fair Use Statement
The information in this article may be shared for noncommercial purposes. Please provide proper attribution and a link back to Utilities Now when referencing or republishing any portion of this content.